Over 100,000 marketers in our community! Let's talk about your technology and marketing events/webinars on our community. Learn More
Harnessing Data Analytics to Optimize Content Marketing
Originally published: August 28, 2024 08:14:03 AM, updated: August 28, 2024 08:17:57 AM

Gone are the days when content marketing depended on blind guesses, luck, and hopeful attempts. With data analytics, you have the power to pinpoint what indeed resonates with your audience.
Everyone is talking about making those important "data-driven" decisions, as organizations that use customer behavioral insights outperform peers by 85% in sales growth. But how do you get that data and stay focused with so many available tools?
We have the perfect guide that will help you gather the correct information and, most importantly, use it to optimize your content strategies.
Key Metrics You Should Track
Tracking the right metrics in the endless sea of data will help you stop the guessing game and know what works.
While there are infinite possibilities on the type and extent of data and metrics you can track, we'll focus on the most important ones. This way, you can be sure your content hits the mark.
Engagement Metrics
Engagement metrics are your first insight into how your audience interacts with your content. These include:
- Page views — This is the number of times a page on your website is viewed. This stat will give you a sense of how much traffic your content is generating.
- Time on page — While people might stumble upon your content, knowing how long they will stick around is important. On average, visitors spend about 54 seconds on a webpage — so try to keep them longer with engaging content!
- Bounce rate — Some people will leave your site after viewing just one page, which is your bounce rate. If the numbers are high, it might be time to optimize your content strategy.
Conversion Metrics
Conversions are the ultimate goal of your content marketing efforts. Here are a couple of key metrics you should keep an eye on:
- Conversion rate — This number shows the percentage of visitors who take a desired action, such as signing up for a newsletter or making a purchase. It's the most direct indicator of how well your content nudges people into action.
- Click-through rate (CTR) — Your CTR is the number of people who click on a specific link compared to the total number of users who view your page. If your rate is higher, it's a good sign that your call-to-action is effective.
- Lead generation — This metric tracks the number of leads generated from your content. This can include form submissions, downloads, or any other method of getting contact information.
Audience Metrics
Knowing your audience and tailoring your content to meet their needs is essential. Here are a few metrics that can help you:
- Demographics — Your insight on age, gender, location, and other factors that show you who your audience is.
- Interests and behavior — What is your audience interested in? How do they browse and behave online? The data can show their personality in detail and help you create more targeted and relevant content.
Content Performance Metrics
Finally, you want to know how well your content is performing in terms of reach and impact. Here is what you should track:
- Social shares — This is the number of times your content is shared on social media. It's a well-known fact that more shares mean more exposure and, with that — more credibility.
- Track influencer content — If you collaborate with influencers to promote your brand, you should also consider tracking influencer performance. Monitoring influencer content's performance can help you understand its impact and effectiveness on your strategy.
- Backlinks — Links from other websites to your content. These are a strong indicator that you are creating something valuable and worth referring to. It will help your search engine ranking and authority in the industry.
- Comments and interactions — Engagement through comments, likes, and other interactions can provide qualitative insights into how your audience feels about your content.
Here is a visual representation of how to track and evaluate content performance. Based on the data from different sources, we compiled a vivid chart showing how much brand awareness, engagement, conversion, and ROI benefit from collaborating with influencers.
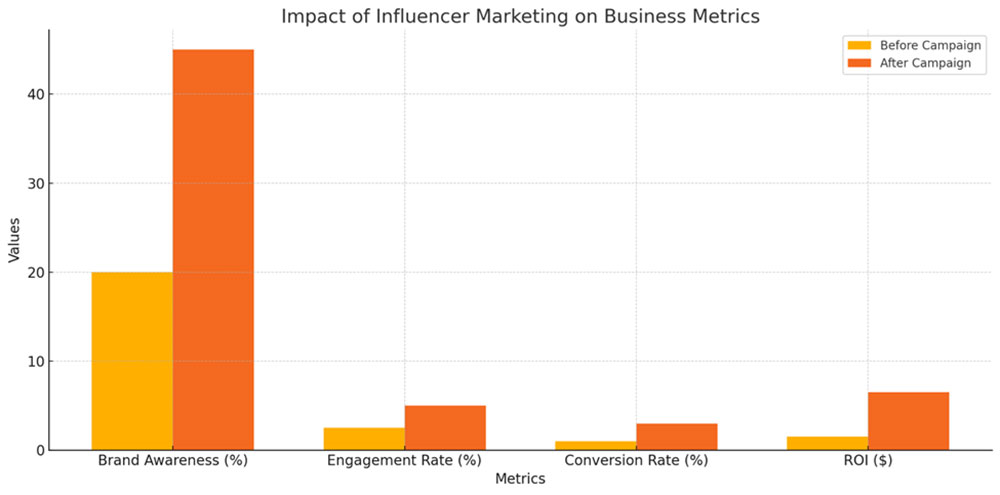
Source: Influencer Marketing Hub, Statista, HubSpot, and Hootsuite
How to Leverage Tools for Data Analysis?
Creating valuable content is great, but what matters more is understanding how that content performs. This is the moment to use data analytics tools to find what your audience enjoys and potential areas for improvement.
Comprehensive Website Metrics
When it comes to understanding your website's performance, Google Analytics should be your go-to tool. It's free, beginner-friendly, and packed with valuable insights that can help you optimize your content marketing strategy.
One of the best things about Google Analytics is that it clearly shows how visitors interact with your site. For instance, you can track page views to see which content draws the most traffic. This helps you identify what topics or formats resonate most with your audience.
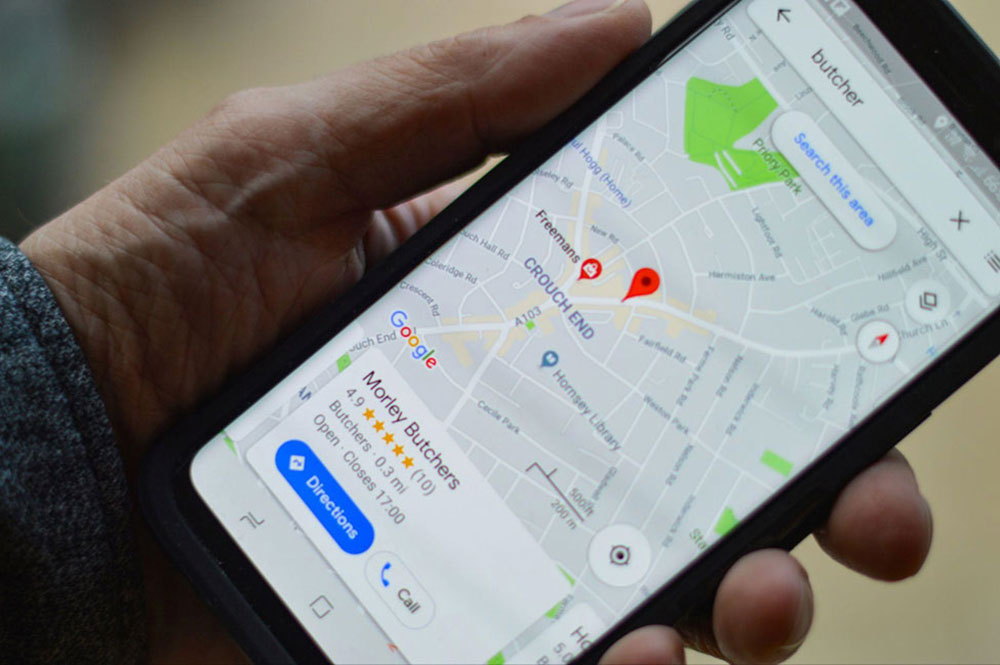
Boosting Local Visibility with Data
Depending on your location and services, a robust local presence can help your business grow. This is where tools such as Google Business Profile shine. You can boost your visibility, gather the data you need, and easily connect with your community.
- First, make sure your Google Business Profile is complete and accurate. Include your business name, address, phone number, and hours of operation. An updated profile helps you appear more in local searches, making it easier for people to find you.
- Next, encourage customers to leave reviews and respond to them quickly! Engaging with reviews builds trust and shows that you value customer feedback.
- Don't underestimate the power of visual content, either. People love seeing real images of what to expect when they visit your business, which can significantly enhance your profile's appeal.
Platforms like this one are pretty user-friendly, and it's only tricky if you have multiple locations on Google Business Profile. If this is the case, you can use scheduling tools to seamlessly post across your multiple business listings on Google Business Profile and keep everything up-to-date and consistent.
Lastly, analyze the performance of your listings. Metrics like views, clicks, and engagement rates provide valuable insight into what works and what doesn't. This data will help you adjust your strategy and improve your local presence.
Gaining Insights from Interactive Content
The best way to gather valuable data and see how your content rates among users is to let them interact with it. The easiest way to do that is to use interactive content, like product demos, to engage people, analyze the results, and get the numbers you need.
Your audience expects personalized and custom-made demos that they can relate to, but creating a product demo for every prospect sounds daunting, right? That's why we're all about automating the process and relying on applications for automated demos. These demo platforms streamline the creation and distribution of interactive demos and provide in-depth user interaction analytics.
For example, you can track how long users engage with each part of the demo, where they click, and at what point they drop off. This data is invaluable for understanding what aspects of your demo captivate your audience and which parts may need improvement.
Conducting Competitive Analysis
Staying ahead of the competition is all about understanding what they're up to. Gathering data on your competitors can gain valuable insights that will keep you on top of your game.
First, let's discuss capturing competitor activities. This might involve monitoring their website updates, new product launches, and marketing campaigns. Your clever spying can help you spot trends, find their strengths and weaknesses, and use the data to your advantage.
Here's a tip: if you want to gather this data, a bit of coding skills can go a long way. For example, you can use a Python script for webpage screenshots. A simple and effective Python code for taking webpage screenshots can track all the changes on a competitor's site for you. It's a handy trick that will save you time and help you effortlessly keep tabs on design and content tweaks.
Our chart below illustrates a fascinating trend: the frequency of website redesigns can significantly influence conversion rates. Why is this important?
Regularly updating and refreshing your website design encourages more visitors to take desired actions. In addition, tracking your competition's redesign is also crucial. By monitoring how often they update their websites and correlating that with their performance, you can peer into their effective practices and implement them in your own business.
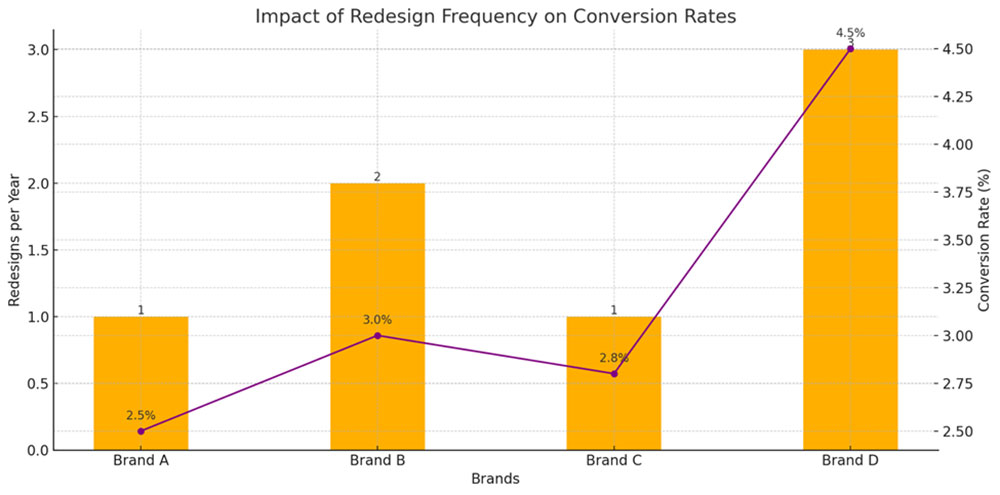
Source: HubSpot, MarketingSherpa
Streamlining Marketing Account Management
With social media platforms in full bloom, you must be present everywhere your audience hangs out. However, managing multiple marketing accounts can be a hassle, so you need a centralized system and easy access.
When you can quickly log in and manage your accounts, you save time and reduce the risk of errors. This seamless access allows you to focus more on analyzing data and making informed decisions rather than getting bogged down by administrative tasks.
Centralized account management is beneficial whether you're handling your marketing in-house or outsourcing it to a marketing agency.
With everything in one place, you can monitor performance, track progress, and make adjustments in real-time. It also simplifies adding team members or external partners to your accounts. However, sharing Facebook or Instagram account access and sensitive information can be risky, so ensure you do it correctly and with the right tools. To be safe, use reliable tools to add users to your Instagram business account and keep everyone in the loop.
Streamlining your marketing account management will boost collaboration and enhance data-driven decision-making. By keeping your accounts organized and accessible, you can focus on what really matters: creating and executing a successful marketing strategy.
Techniques to Get the Most Out of Your Data
Now that you know what data to collect and what tools are your allies on this adventure, it's time to move on to actionable steps — use the data to optimize your content marketing.
Here are a few suggestions to get you started:
1. Personalize Your Content
You gathered data that helps you imagine your customers in detail. Now is the time to deliver the right message to the right person at the right time. By using audience data, you can tailor your content to specific segments, making it both relevant and engaging.
- You noticed that your audience is into eco-friendly products. In fact, Gen Z is 91% more likely to buy from sustainable businesses. So, you can create content that highlights your sustainable practices and products.
2. Test and Learn with A/B Testing
A/B testing, or split testing, is a powerful method for determining what content resonates best with your audience. By testing different variations of your content, you can see which version performs better regarding engagement, conversions, and other key metrics.
- You could test two different headlines for a blog post to see which one attracts more readers. Or, you could test different call-to-action buttons to see which one drives more conversions.
3. Make the Most of High-Performing Content
If you notice that some content outperforms the rest, it's time to use it even more. Tweak and adapt your high-performing content and publish it on different channels. This is the glorious and creative universe of content repurposing.
- Turn your well-received blog post into a series of social media posts, infographics, or even a video. This way, you will reach a wider audience and reinforce your brand identity on various platforms.
4. Boost Your SEO Game
Use the data you collected to refine your SEO strategies. By analyzing data from tools like Google Search Console and SEMrush, you can identify keywords driving traffic to your site and optimize your content accordingly.
- If you notice that a particular keyword is performing well, you can create more content around that keyword to capture more search traffic. Additionally, you can use data to identify and fix any SEO issues on your site, such as broken links or missing meta tags.
Final Thoughts
We removed the guessing game and relied only on clear, actionable insights to guide your content marketing.
When you learn what metrics to track, use advanced tools to gather data, and then use the same data — you are on your way to creating content that resonates and converts. Data will help you understand what your audience loves and tailor your messages to meet their needs.
Join over 100,000 SEO and Google Ads experts. We provide a community to help you engage and learn from industry experts and influencers. Join Now
Get Media Coverage for Your Business!
Get published on Google News, AP News, Benzinga, over 100+ NBC, FOX, ABC & CBS affiliate sites and more.


